| Home |
Theoretical
Background
|
| Validation |
Application Using
|
| Landing Sites |
Scientific Applications
|
| References |
| Contact us |
| This project is funded by the Mars Data Analysis Program (MDAP) |


Relative
Roughness mapping:
The 'two-look' approach for mapping surface roughness on Mars relies on the correlation between surface roughness (SR: defined here as the unresolved topographic expression of the surfaces) and the amount of unresolved shadows cast on the surface, which lead to deviation from Lambertian reflection. Stereo images or repeat images acquired at different illumination geometries offer us an efficient tool to quantify this deviation from Lambertian reflection as a quantitative measure for unresolved roughness within the pixel.
For a detailed description of the 'two-look method please refer to the following publications:
Mushkin & Gillespie, 2005
Mushkin & Gillespie, 2006
Click here for an interactive slide show.
The ‘two-look approach for mapping sub-pixel surface roughness. a) Subset of Spirit Pancam image #2P136234337EFF3600P2401R1M1 on sol 111 (https://marsrovers.jpl.nasa.gov/gallery/all/). Fewer shadows are cast in smooth ’pixel A’ than in rough ‘pixel B’. Image is ~1m across. b) The difference in surface lightness viewed from different angles but the same illumination angle is related to the amount of sub-pixel shadowing and roughness. Shadows in pixel B that are not visible to the sensor from L2 become visible from L1, the integrated result over a pixel area will be darkening of L1-B relative to L2-B. Area A has few shadows and therefore no lightness difference will be observed between L1-A and L2-A. c) Same concept as b), only here illumination angle changes and view angle remains the same. From Mushkin & Gillespie, 2006.
Calibration to physical roughness parameters:
-
1. Empirical
calibration using in-situ ground measurements

Gusev Crater: a) HRSC at-sensor radiance
ratio between co-registered S1 and S2 stereo images.
The ~30-m/pixel data were re-sampled to the ~1.5-m/pixel
resolution of the MOC mosaic (https://www.msss.com/mars_images/moc/2005/01/03/) on which they are superimposed. Dotted line represents the
traverse of Spirit from its landing site at the Columbia Memorial
Station (CMS) through Bonneville Crater (BC), Missoula
Crater (MC), Lahontan Crater (LC) and towards the Columbia Hills (not
shown). North is up. b, c and d) Subsets from
Spirit’s Pancam at CMS (b), Legacy Station ~half
way to BC c), and on the rim of BC d) in order of increasing
roughness. Pancam images released 1/27/2004, 2/08/2005 and
3/15/2004, respectively (https://marsrovers.jpl.nasa.gov / ). The
sandy floor of BC is shown on the right side of e). e) Subset of mosaic from
Spirit navigation camera (released 04/26/2004, (https://marsrovers.jpl.nasa.gov / ) showing the
characteristic intercrater terrain between MC ejecta blanket and
LC.
Calibrated roughnesses: f) Calibration of HRSC-derived relative-roughness estimates to % rock abundance as estimated by Golombek et al. (2005) for locations b, c, and d) from ground measurements. An additional point from the relatively rock-free (assumed 1% rock abundance), sandy floor of BC was added to the calibration curve. Dashed lines represent the 1-sigma error bounds associated with this regression. g) Calibrated roughness levels (as % rock abundance) using curve from f) and the data presented in f). Dotted line represents approximate traverse of Spirit and lettering is the same as in a).
2. Empirical Calibration using HiRISE rock counts (Smith et. al, 2008)


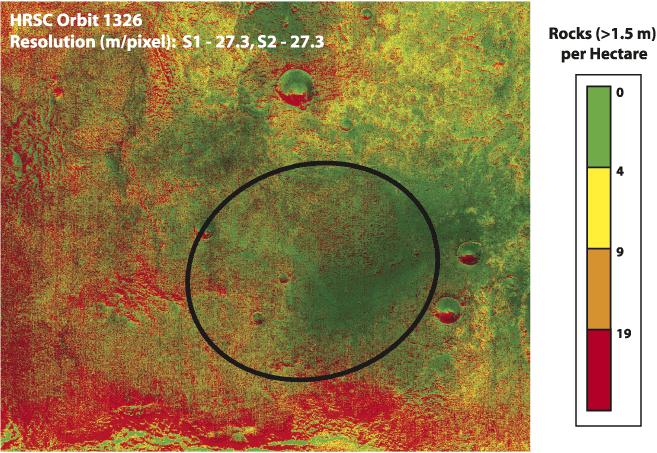
HRSC calibrated roughness image for Mawrth produced using the calibration curve above.

Calibrated roughnesses: f) Calibration of HRSC-derived relative-roughness estimates to % rock abundance as estimated by Golombek et al. (2005) for locations b, c, and d) from ground measurements. An additional point from the relatively rock-free (assumed 1% rock abundance), sandy floor of BC was added to the calibration curve. Dashed lines represent the 1-sigma error bounds associated with this regression. g) Calibrated roughness levels (as % rock abundance) using curve from f) and the data presented in f). Dotted line represents approximate traverse of Spirit and lettering is the same as in a).
2. Empirical Calibration using HiRISE rock counts (Smith et. al, 2008)


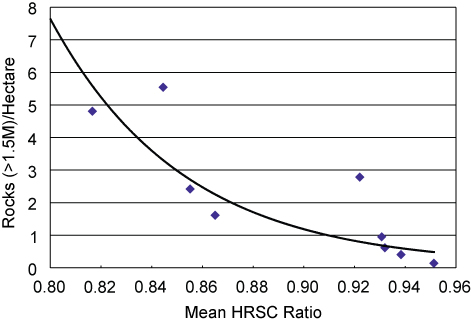
Example of
calibration curve derived by comparing HiRISE rock
counts and HRSC ratios.
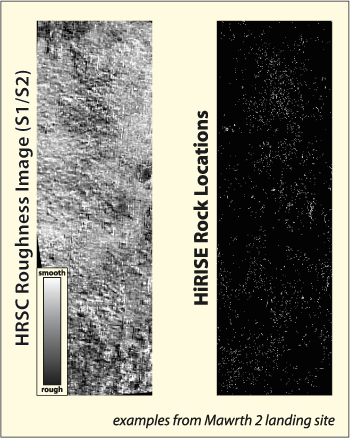
Overlapping HRSC roughness image
and HiRISE rock count (Golombek et. al, 2008).
We used stereo HRSC images, calibrated by automated HiRISE boulder counts
(performed at JPL), to predict and map the abundance of large and hazardous
rocks at the potential landing sites to determine their relative safety and prioritize
them accordingly.
We used stereo HRSC images, calibrated by automated HiRISE boulder counts
(performed at JPL), to predict and map the abundance of large and hazardous
rocks at the potential landing sites to determine their relative safety and prioritize
them accordingly.

HRSC calibrated roughness image for Mawrth produced using the calibration curve above.

Shadows from all sizes of rocks
contribute to sub-pixel shadowing,
including those which do not pose a danger to a rover. However, rock
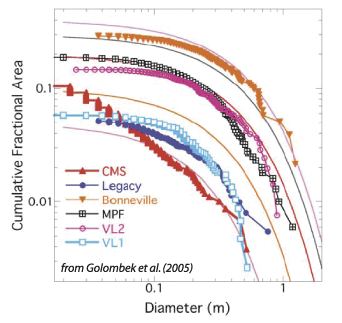
distributions on Mars and Earth have predictable shapes (Golombek, 2005)
which are described by fracture theory (e.g. Gilvarry, 1961). Therefore, the
effect of shadowing by small rocks is included in our ratio, but their
abundance is predicted by the abundance of larger rocks (such as those
resolved by HiRISE, >1.5 m). Therefore, an entire population of rocks is
solved for in our regression, and the number of resolved rocks (>1.5 m)
correlates to a proportional number of unresolved rocks (>0.55 m), which are
deemed dangerous for rover landing.
3. Model
Based
Under construction
Under construction